I published my first post on this blog on March 24, 2012. Back then its title and tagline were:
Theory and Practice of Trying to Combine Just Anything
Physics versus engineering
off-the-wall geek humor versus existential questions
IT versus the real thing
corporate world’s strangeness versus small business entrepreneur’s microcosmos knowledge worker’s connectedness versus striving for independence
… which became
Theory and Practice of Trying to Combine Just Anything
I mean it
… which became
elkemental Force
Research Notes on Energy, Software, Life, the Universe, and Everything
last November. It seems I have run out of philosophical ideas and said anything I had to say about Life and Work and Culture. Now it’s not Big Ideas that make me publish a new post but my small Big Data. Recent posts on measurement data analysis or on the differential equation of heat transport are typical for my new editorial policy.
Cartoonist Scott Adams (of Dilbert fame) encourages to look for patterns in one’s life, rather than to interpret and theorize – and to be fooled by biases and fallacies. Following this advice and my new policy, I celebrate my 4th blogging anniversary by crunching this blog’s numbers.
No, this does not mean I will show off the humbling statistics of views provided by WordPress :-) I am rather interested in my own evolution as a blogger. Having raked my virtual Zen garden two years ago I have manually maintained lists of posts in each main category – these are my menu pages. Now I have processed each page’s HTML code automatically to count posts published per month, quarter, or year in each category. All figures in this post are based on all posts excluding reblogs and the current post.

Since I assigned two categories to some posts, I had to pick one primary category to make the height of one column reflect the total posts per month:
It seems I had too much time in May 2013. Perhaps I needed creative compensation – indulging in Poetry and pop culture (Web), and – as back then I was writing a master thesis.
I had never missed a single month, but there were two summer breaks in 2012 and 2013 with only 1 post per month. It seems Life and Web gradually have been replaced by Energy, and there was a flash of IT in 2014 which I correlate with both nostalgia but also a professional flashback owing to lots of cryptography-induced deadlines.
But I find it hard to see a trend, and I am not sure about the distortion I made by picking one category.
So I rather group by quarter:

… which shows that posts per quarter have reached a low right now in Q1 2016, even when I would add the current posting. Most posts now are based on original calculations or data analysis which take more time to create than search term poetry or my autobiographical vignettes. But maybe my anecdotes and opinionated posts had just been easy to write as I was drawing on ‘content’ I had in mind for years before 2012.
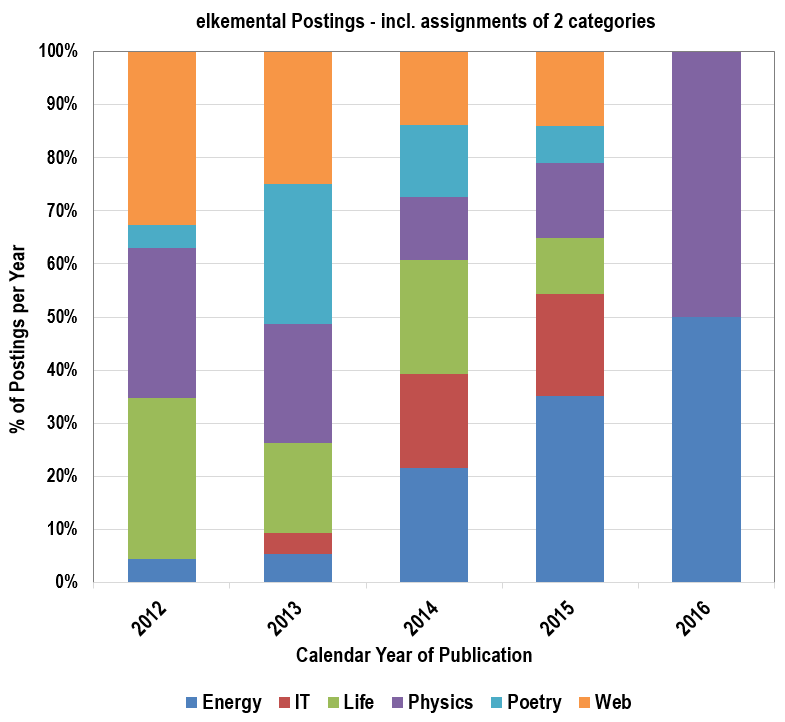
In order to spot my ‘paradigm shifts’ I include duplicates in the next diagram: Each post assigned to two categories is counted twice. Since then the total number does not make sense I just depict relative category counts per quarter:

Ultimate wisdom: Life ends, although Energy is increasing. IT is increasing, too, and was just hidden in the other diagram: Recently it is often the secondary category in posts about energy systems’ data logging. Physics follows an erratic pattern. Quantum Field Theory was accountable for the maximum at the end of 2013, but then replaced by thermodynamics.
Web is also somewhat constant, but the list of posts shows that the most recent Web posts are on average more technical and less about Web and Culture and Everything. There are exceptions.
Those trends are also visible in yearly overviews. The Decline Of Web seems to be more pronounced – so I tag this post with Web.


But perhaps I was cheating. Each category was not as stable as the labels in the diagrams’ legends do imply.
My ‘category pages’ are not fully in sync with the true feed of each (WordPress) category.
Somehow…
public-key-infrastructure became control-and-it
and
on-writing-blogging-and-indulging-in-web-culture is now simply web
… and should maybe be called nerdy-web-stuff-and-software-development.
In summary, I like my statistics as it confirms my hunches but there is one exception: There was no Poetry in Q1 2016 and I have to do something about this!
_____
The Making Of
- Copy the HTML content of each page with a list to a text editor (I use Notepad2).
- Find double line breaks (\r\n\r\n) and replace them by a single one (\r\n).
- Copy the lines to an application that lets you manipulate strings (I use Excel).
- Tweak strings with formulas / command to cut out date, url, title and comment. Use the HTML tags as markers.
- Batch-add the page’s category in a new column.
- Indicate if this is the primary or secondary category in a new column (Find duplicates automatically before so 1 can be assigned automatically to most posts.).
- Group the list by month, quarter, and year respectively and add the counts to new data tables that will be used for diagrams (e.g. Excel function COUNTIFs, using only the category or category name + indicator for the primary category as criteria).
It could be automated even better – without having to maintain category pages by simply using the category feeds or by filtering the full blog feed for categories. I have re-categorized all my posts so that categories matches menu page lists, but I chose to use my lists as
- I get not only date and headline, but also my own additional summary / comment that’s not part of the feed. For our German blog, I actually do this in reverse: I create the HTML code of a a sitemap-style overview page on wordpress.com from an Excel list of all posts plus custom comments and then copy the auto-generated code to the HTML view of the respective menu page on the blog.
- the feed provided by WordPress.com can have 150 items maximum no matter which higher number you try to configure. So you need to start analyzing before you have published 150 posts.
- I can never resist to create a tool that manipulates text files and automates something, however weird.


Leave a Reply