Once upon a time I analyzed electron diffraction patterns.
They looked like this:

These patterns are the inverse of the crystal lattices, sort of. The regularity of the dots represents the symmetries of the physical crystal.
To identify the material causing a certain pattern, you compared it with sample patterns in a “database”. I am using quotes as the database was a drawer cabinet from wood. You sifted through sample patterns, following cues on little index cards. The distance between dots lets you calculate the distance between planes populated by atoms – given the wavelength of the electron waves and a constant characteristic for the geometry of the system. Using this atomic distance you hunted for candidate materials. You refined your search based on other planes in the crystal, and by using what you knew about the material (Stainless steel in my case).
It was a very chill work at the time “immediately before the onset of ubiquitous software”. One of my first task in my job was to migrate that ancient archive to a then “modern” DOS-based software for analyzing diffraction patterns.
I am looking back through rose tinted glasses. But even correcting for my bias, I feel this slow – manual and “tedious” – way of working was healthy and natural. You weren’t glued to your desk, and you weren’t overwhelmed by the speed of a machine. You waited for the machine to be done, not the other way round.
I think of this every time I read how experienced software engineers describe how they turned from developers to – effectiveley – lead engineers or project managers supervising their AI agents. They are not anti-AI, but have a pragmatic approach. They describe how coding the old way, lost in the craft, was more chill. You accomplished less in a certain time for sure.
~
Years before working with the physical archive I analyzed superconducting materials via X-ray diffraction. I felt, I was always the person who had to feed a new roll of paper to this apparatus.
I transferred the peaks on the large paper to a small plot by re-tracing just the peaks (without all the lines) to overhead transparency foils. Then I scaled this down using a photocopier.
The X-ray diffractometer was in the basement of the science building, a tower with 10 floors. I remember the soothing effect of traveling down to this tranquil world.
~
Traveling back in time even more, I was growing my own crystals as a child – for example from copper sulfate and potassium alum. No photo of those experiments exist, and I haven’t kept the crystals. Back then, we had those share-worthy hobbies, but we did not document and share as we do today.
I was fascinated by these polyhedra growing slowly from a nucleus suspended in these (toxic) solutions, and I was reading about mineralogy – one of the first subjects I considered studying.
The challenge I set for myself was: Look at the photo or drawing of a crystal and create a contiguous net – a single piece of paper to be cut outl folded and glued. I succeeded for all the simpler polyhedra, and kept adding more surfaces.
If I recall correctly, I reached the limit with this one. It was too complex, and I had to “cheat”: I crafted a few pyramids as separate items to be tacked on the larger pieces created from a single net.

I remember the German name as Festes kleines gesterntes Rhombikosidodekader – but I am not sure if this is correct. It is based on a regular dodecahedron from 12 pentagons. Then you move the pentagons away from each other and fill the empty spaces with triangles and squares, and finally erect a pyramid on all the faces.
~
Crystallography and these ways of tinkering with shapes was perhaps my first attempt at “mathematical art”, but I was never thinking of it in terms of art. I just wanted to see these polyhedra come to life in three dimensions – slowly emerging from an aqueous solution or crafted from paper.
All of this – the chill work and the clandestine hobbies – might have been on my mind when I slowly gravitated towards my style of illustrating physics: On paper, using a painstaking process.
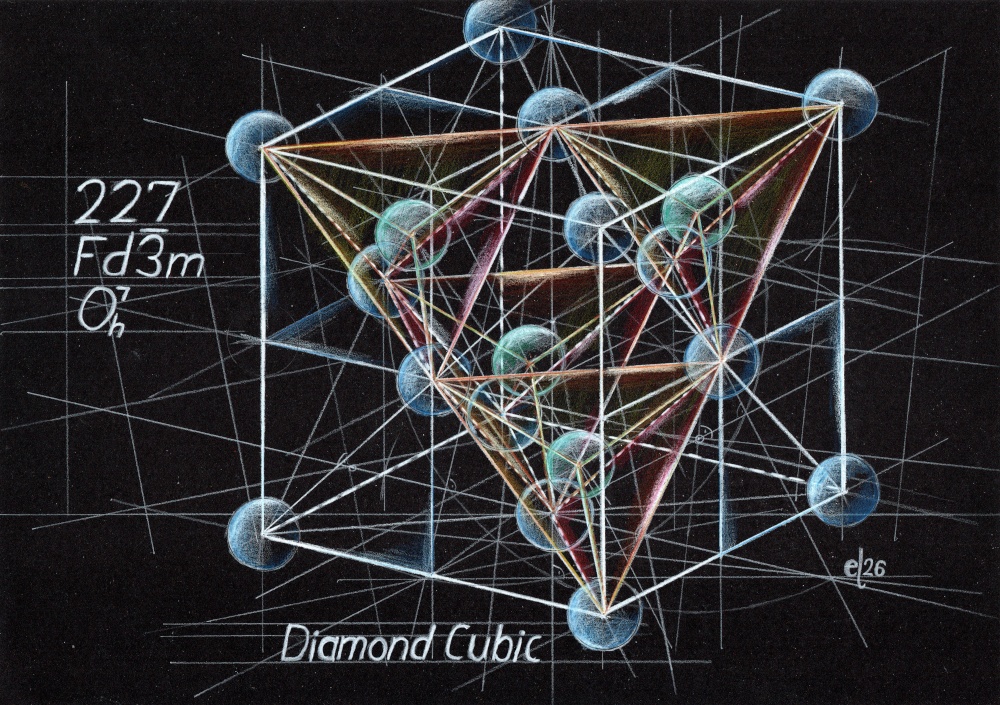
I only made this connection myself after I had completed this – the crystal structure of diamond:

This structure consists of two face-centered cubic lattices (cubes of atoms decorated with additional atoms in the centers of the faces), shifted by a quarter of the space diagonal of one of the cubes. Both of these lattices are populated by carbon atoms, and I color them blue and green respectively.
When the green atoms move along the space diagonal, they become the centers of tetrahedrons (highlighted in warmer colors): Each green atom is surrounded by four blue ones.
Diamond Cubic is not a “lattice” in the sense that it could be created by putting its atoms at the start and end points of translations vectors – whose actions would create the whole lattice. Lattice means: One atom per unit cell. Face-centered cubic is a true lattice, but you use it as a container here: You need to allow for a second atom per unit cell.
The enigmatic symbols are shorthands crystallographers have invented to classify crystal structures. 227 is just a number in a list of crystal structures, approximately sorted from least symmetric to most symmetric. The other two symbols are more descriptive, in total describing 48 symmetry operations: Actions that make / keep the whole crystal congruent with itself.
The complete list has 230 entries, and surprisingly Diamond Cubic is – in terms of these classifications – as symmetric as the simple cubic lattice (which features an atom at each corner of a cube, so a single atom per cubic cell). This is because not only rotations, translations, or inversions are counted here. There are also “glide translations” (translation followed by reflection) and rotoinversions (rotation combined with inversion).
There are many websites giving an overview of all this classification, and introducing more pictorial shorthands and symbols. I am just dropping some of these links for my own future reference:
~ Diamond cubic lattice: https://en.wikipedia.org/wiki/Diamond_cubic
~ Space group 227: https://onlinelibrary.wiley.com/iucr/itc/Ab/ch7o1v0001/sgtable7o1o227/
~ All space groups:
http://img.chem.ucl.ac.uk/sgp/large/sgp.htm
https://en.wikipedia.org/wiki/List_of_space_groups
~ Schönflies notation: https://en.wikipedia.org/wiki/Schoenflies_notation
~ Hermann–Mauguin notation:
https://en.wikipedia.org/wiki/Hermann%E2%80%93Mauguin_notation
https://www.mindat.org/article.php/2742/Hermann-Mauguin+Symmetry+Symbols
~
Creating a cube is the Hello, World! of 3D geometric art – both in drawing and when using software.
For picturing the atoms in the diamond crystal you just need to get the axis right, draw the corners of a cube, and then keep bisecting lines and connecting points.

Research / test drawings and the final result in black paper.
It has been a humbling experience how difficult it was to avoid connecting the wrong points. But this is why all the classification schemes have been invented.
The full structure is hard to manipulate in your head at once; so you turn it into a list of operations. You turn it into a list that can be followed sequentially.
This is just what happens when you turn geometry into mathematical equations and then into code – into manageable symbols and steps documented in a linear order.
The challenge to the do the reverse is one of my inspirations.
~



Leave a Reply